While the number of criminal cases filed in Ocean City jumped from 330 in May to 1066 in June, July cooled off to 580 cases filed(nearly a 50% drop).
Why was this? Was it the temperature? The average high for Ocean City was 60.6 in April, 68.6 in May (up 8), 78.6 in June (up 10), and 84.1 in July (up 5.5) representing an increase of 13.2% April-May, 14.6% May-June, and 7% June-July. There doesn’t seem to be a direct correlation between either average high temperature or change in average high-temperature, though the fact that the change in increase dropped from June-July may have some relationship to the decline in criminal cases filed.
Did precipitation temper an otherwise greater criminal showing? Precipitation in Ocean City (Salisbury, but still) averaged .12″ in May, .32″ in June, and .15″ in July… so if anything, June would have been the month most tempered by precipitation.
Or it could just be that schools get out in early/mid-June (while this wouldn’t have a direct impact on criminal cases filed in District Court, since the overwhelming number of school-age children are under 18, it may have a snowball-type affect on crime generally).
Or it could be that the rate of change in the population itself caused a snowballing criminal impact… Or maybe a LOT of old cases got cleared in June… Or any number of other factors… still, it’s interesting to think about.
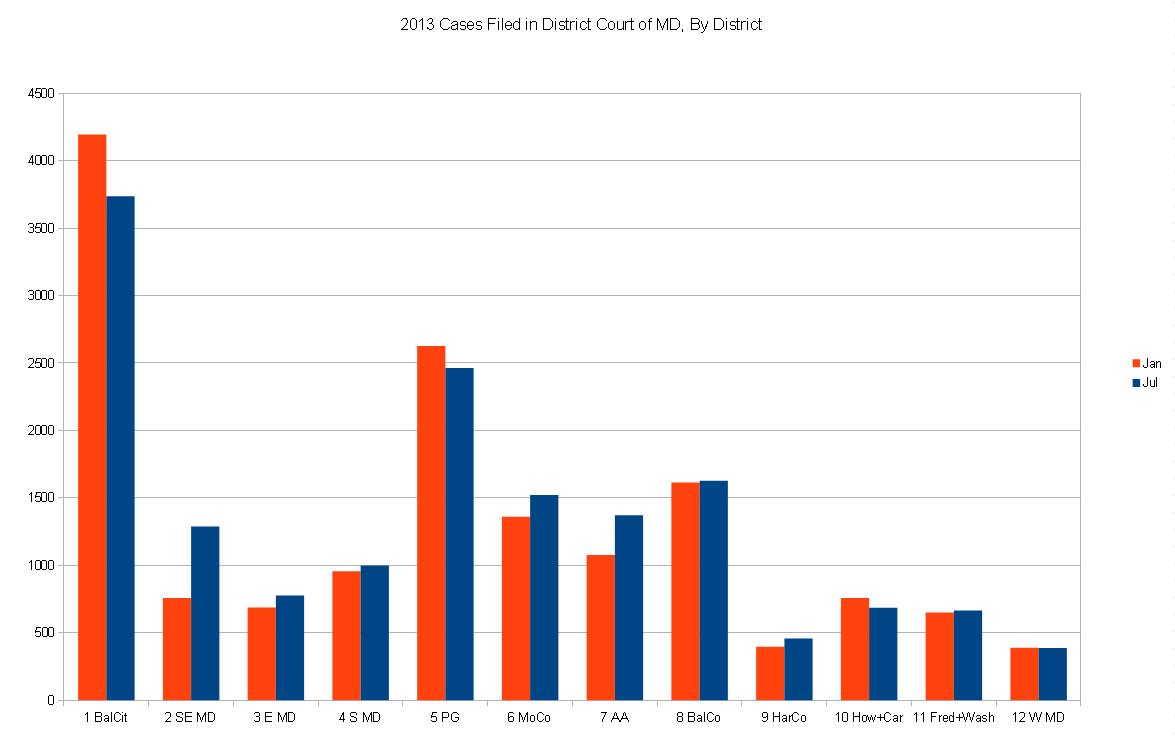
I finally broke down and separated out the data for all 12 judicial districts and so I contrasted each district’s July 2013 numbers with its January 2013 numbers to give a small degree of perspective (related primarily to the lack-of-change)
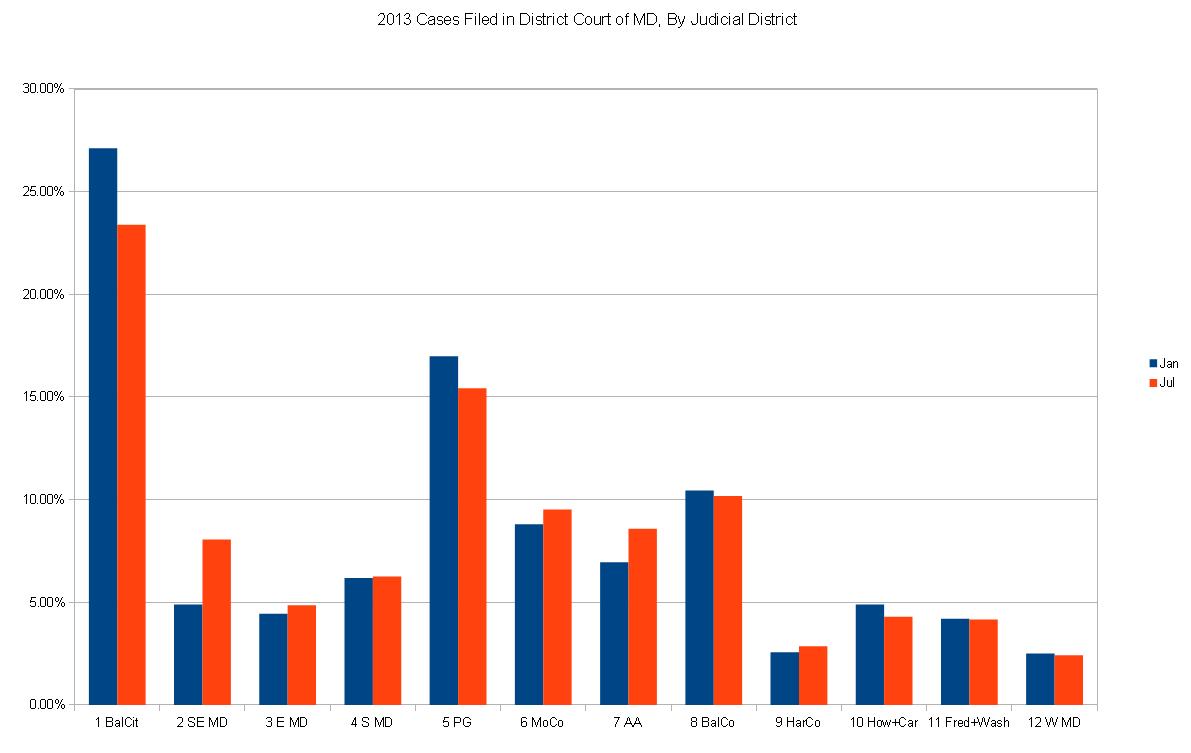
And here the districts are as a percentage of total DC cases filed in Maryland that month
* While previously I had only been updating the spreadsheet with the “top offenders” in terms of cases filed, I’m expanding the spreadsheets to include all 12 judicial districts and so it will be a little while before the spreadsheet on the side gets updated while I backfill the data for 2013.


